
Sustainability
Our approach to sustainability
Aker BP’s vision is to be the exploration and production (E&P) company of the future. Sustainability is central to this vision and forms an integral part of our strategy.
We work to improve our environmental, social and governance (ESG) performance, acting ethically and transparently to ensure our actions benefit people and avoid harm to the environment.
Our sustainability framework brings together our ESG domains and defines principles that guide everyday decisions, operational practices and strategic priorities.
Our core beliefs
Our vision to be the E&P company of the future is founded on our belief that the world needs affordable and reliable energy, and that oil and gas will remain part of the energy mix for decades to come. We contribute to energy security and affordability by delivering low-cost oil and gas produced with an industry-leading low equity share scope 1 and 2 GHG emission intensity.
A significant transformation of the energy system is needed to minimise emissions and meet the growing demand for affordable, reliable and clean energy. While the demand for oil and gas is expected to decrease it will nevertheless remain a significant energy source and feedstock for the foreseeable future.
World energy supply in 2040
Source: IEA World Energy Outlook 2025
Aker BP’s role in the energy landscape

Maximising value creation for shareholders and society while producing the energy the world needs
Minimising emissions and achieving equity share scope 1 and 2 GHG emission neutrality from 2030
Sharing technology and knowledge to drive innovation and support the development of low-carbon solutions
Climate and circularity
We are working to reduce emissions from our own operations and use resources more efficiently through measures such as electrifying assets, improving energy efficiency, reusing materials and minimising waste – while continuing to deliver reliable energy.
29%
reduction
in operational control scope 1 and 2 GHG emissions (2025), compared to our 2017 baseline
2.8
kg CO2e/boe
equity share scope 1 and 2 GHG emission intensity (2025)
0.017%
CH4/
saleable gas
operational control scope 1 methane emission intensity (2025)
Aker BP – an industry leader in oil and gas production with low GHG emission intensity
Aker BP has emerged as a global industry leader in oil and gas production with low GHG emission intensity. In 2023, data from Wood Mackenzie placed Aker BP among the top five percent of the world’s 285 largest oil and gas companies in terms of lowest GHG emission intensity from production.
GHG emission intensity of 285 largest producing upstream companies
Climate-related targets
Our strategy to achieve this
Aker BP is committed to reducing GHG emissions from our own operations through our climate and energy policy. Our approach to decarbonisation is built around the principles of avoid – reduce – neutralise
Scope 1 and 2
Avoid
We aim to avoid emissions through electrification of greenfield developments, drilling using power from shore, portfolio management and optimisation of existing infrastructure
Reduce
We aim to reduce emissions through active energy management and brownfield electrification
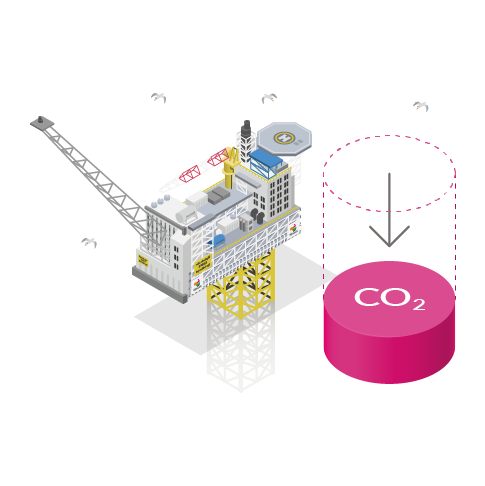
Neutralise
For every tonne of remaining equity share scope 1 and 2 GHG emissions from our operations, we aim to capture one tonne of CO2 from the atmosphere through high-quality carbon dioxide removal projects from 2030
Scope 3
Identify cost-efficient initiatives to reduce GHG emissions in our supply chain
Support new industries and drive technology development
Explore potential of CCS
Progressing towards our targets
Through our climate and energy policy, Aker BP is committed to reducing GHG emission from our own operations. To support this, we have developed an ambitious decarbonisation plan. The plan is anchored in our overarching business strategy, our sustainability framework as well as our climate and energy policy.
Operating with industry-leading low GHG emission intensity
Our GHG emission intensity from production has been significantly reduced in recent years, mainly driven by the electrification of the Edvard Grieg and Ivar Aasen fields in 2022, continuous improvements in energy efficiency across the asset portfolio, and the start of production from the Johan Sverdrup field in 2019, powered with electricity from shore.
Our GHG emission intensity from production is significantly lower than the average in the global oil and gas industry(1) and below the average for operators on the Norwegian continental shelf.
(1) The global average upstream GHG emission intensity in 2024 was 17.8 kg CO2e / boe according to the International Association of Oil & Gas Producers (IOGP) (Source: IOGP Environmental performance indicators – 2024 data)
Aker BP equity share scope 1 and 2 GHG emission intensity compared to global average
IOGP Environmental performance indicators – 2024 data
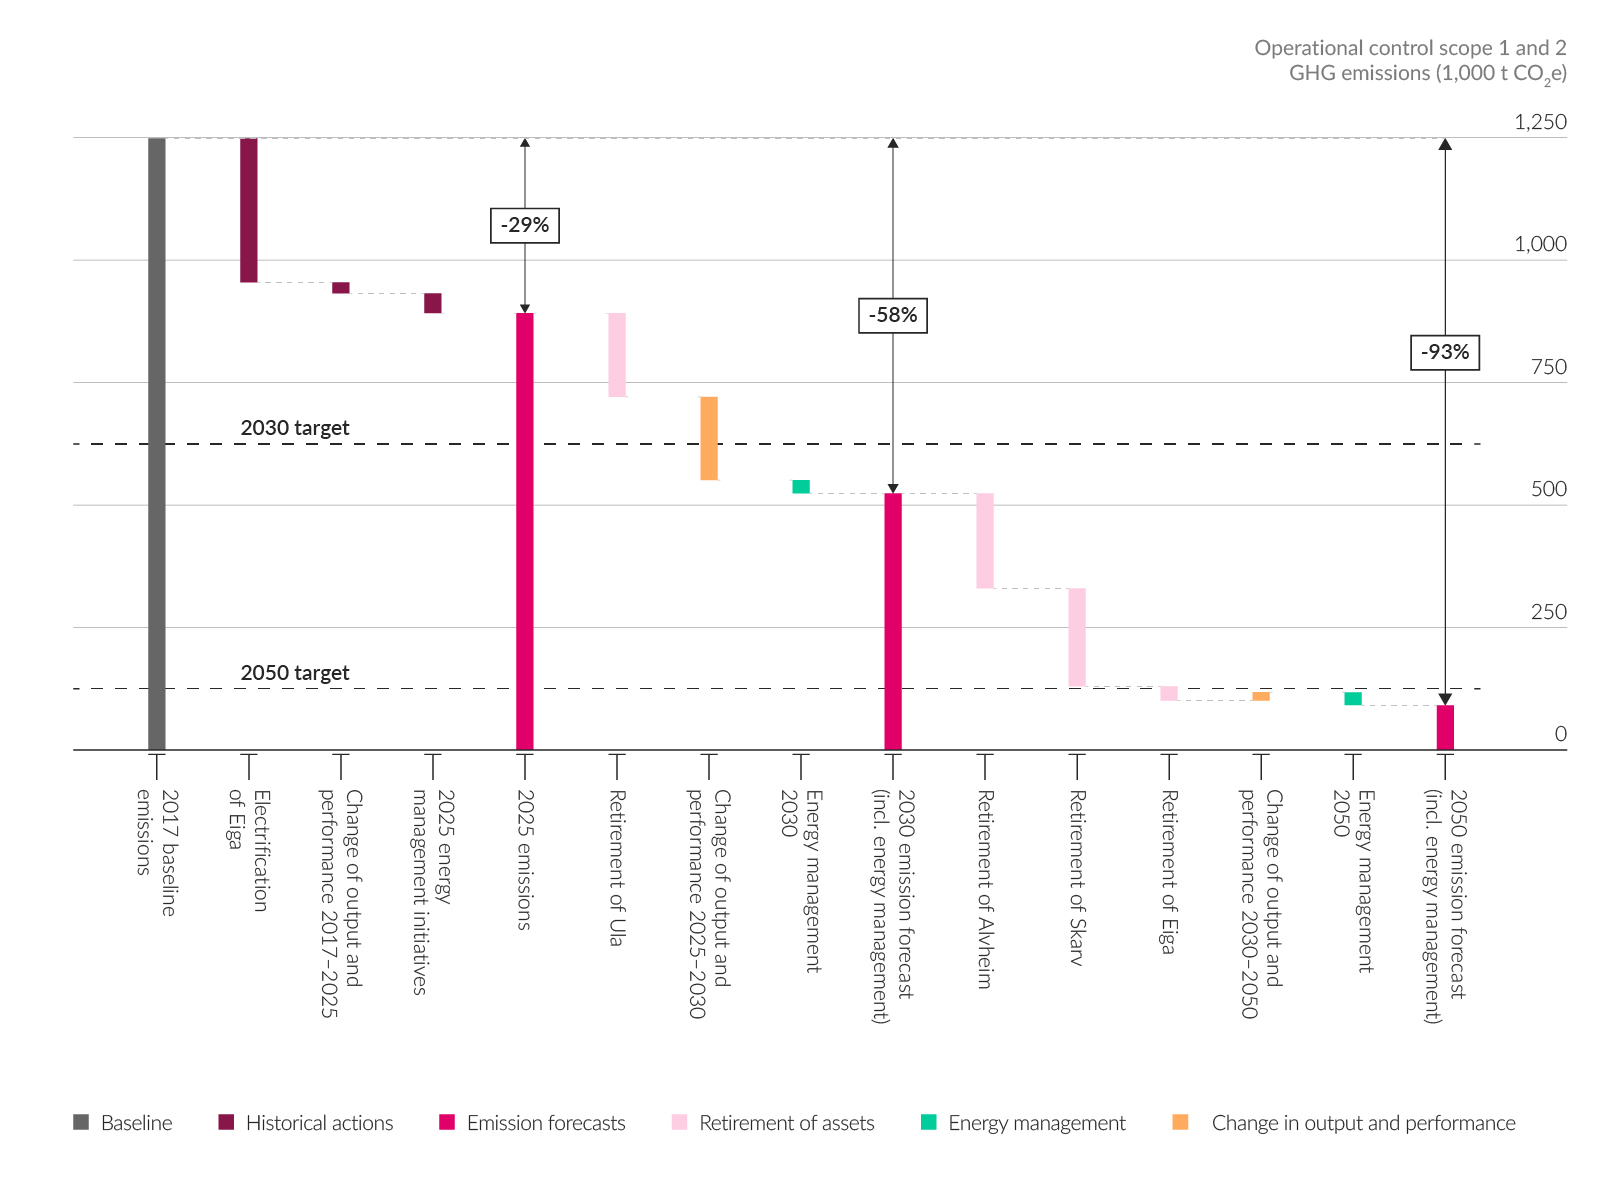
Our pathway to reducing emissions from own operations by 90 percent
Aker BP has an ambition to achieve a 50 percent reduction in GHG emissions from our operated activities by 2030. By 2050, we aim to reduce emissions from our own operations by 90 percent.
Aker BP aims to further reduce GHG emissions from our own operations through efforts such as electrification, energy management, minimised flaring, cold venting and fugitive emissions, portfolio management, optimisation of existing infrastructure and where feasible, selection of technology and services with lower environmental footprint.
Pathway to 90% reduction in operational control scope 1 and 2 GHG emissions by 2050
Achieving GHG emission neutrality for own operations
Our approach to decarbonisation emphasises that we will prioritise emission reductions from our own operations where feasible leading up to and after 2030. In addition, we aim to neutralise every remaining tonne of scope 1 and 2 GHG emissions from our own operations from 2030 onwards, using high-quality carbon dioxide removal (CDR) credits.
Aker BP has identified several criteria for our CDR portfolio, seeking to ensure that the CDR projects in our portfolio are removal-based projects only, that the CO2 removals are additional and durable, and that the project developer addresses potential leakage risks and risks of environmental and social harm . More information on our principles for CDR can be found in our climate and energy policy.
Reducing methane emissions
Aker BP aims to minimise methane emissions and maintain a methane emission intensity from our operated activities of below 0.05 percent of the total volume of saleable gas.
Aker BP is a member of the Oil and Gas Methane Partnership 2.0 (OGMP 2.0), a UN Environment Programme initiative that aims to improve the accuracy and transparency of methane emissions reporting and mitigation for the oil and gas industry.
Historical and projected operational control scope 1 methane emission intensity
Managing scope 3 emissions in our supply chain
At Aker BP, we recognise the importance of close collaboration with our suppliers and contractors to improve our scope 3 reporting. We aim to use our role as a major player on the Norwegian continental shelf to positively influence our supply chain and drive meaningful reductions to our upstream scope 3 emissions.
We are continuously working to identify cost-efficient improvement initiatives that reduce GHG emissions in our supply chain. We may consider setting upstream scope 3 emission reduction targets in the future if we identify a performance indicator suitable for our business model.
Evaluating carbon capture and storage (CCS) opportunities
We expect carbon capture and storage to play a key role in the transition to a low-carbon energy future, and the Norwegian continental shelf holds significant potential for carbon storage.
Aker BP’s ambition is to establish a profitable CCS business. Our CCS activities currently have three focus areas. Firstly, we are capturing high-quality subsurface opportunities and assessing their suitability for carbon storage through detailed subsurface studies. Secondly, we are evaluating field development concepts to mature projects towards development decisions. Thirdly, we are establishing strategic partnerships across the CCS value chain to develop a viable business model, while collaborating with the industry and authorities to establish a regulatory and fiscal framework for CCS.
Circular economy
Aker BP’s model for circular economy emphasises sustainable production and consumption to increase resource efficiency and reduce waste generation. We consider the integration of circular economy principles into our business model essential to reduce the consumption of and dependency on virgin resources, reduce scope 3 emissions and biodiversity footprint, and achieve financial benefits.
We aim to reduce waste at the source through operational efficiencies and sustainable design, reusing and repairing existing equipment and materials, and applying recycling and energy recovery where appropriate. This aims to ensure that equipment and materials are kept at their highest possible value for as long as possible.
- Reduce resource use and waste through operational efficiency and sustainable design
- Reuse, repurpose and repair equipment to extend material lifecycle
- Recycle materials to replace virgin material use
- Recover energy from waste
Waste management
As part of our ambition to minimise our environmental impact, we work to reduce waste generation and optimise resource utilisation. Our approach to achieving this is: prevention, minimisation, reuse, recycling, recovery, disposal.
Our waste handling procedures and processes comply with all relevant regulations on sorting, storage, classification, labelling, transportation and reporting. Waste management plans have been developed for all assets to ensure optimal resource utilisation and support sustainable waste practices.
Waste handling compliance is part of internal HSE verifications, as well as supplier audits and site verifications. We also provide training for employees and contractors, covering best practices in waste management.
Aker BP runs several projects and initiatives aimed at diverting waste from landfills and promoting the reuse of materials and recycling of waste. We prioritise efforts based on the largest waste streams, with a particular focus on drilling-related waste, where prevention and minimisation are key.
By reusing materials and recycling waste, we reduce our environmental footprint. Waste from Aker BP’s decommissioning projects normally achieves a recycling degree of at least 95 percent.

Disposal App: Empowering circular economy at Aker BP
Aker BP is committed to advancing the circular economy by maximising the value and lifespan of equipment and materials across its operations. The Disposal App is a key digital tool designed to support this ambition, making it easy for employees to identify, register and facilitate the reuse of surplus assets within the company or through donations and sales to external partners.
Through the Disposal App, Aker BP streamlines the process of giving equipment and materials a second life – whether by reallocating items internally, donating to local schools and organisations, or selling to other businesses. This approach not only reduces waste and environmental impact but also strengthens community ties.
This app is part of a broader strategy to embed circular economy principles into daily operations, ensuring resources are kept in use for as long as possible. By enabling efficient tracking and management of surplus assets, the Disposal App helps Aker BP minimise material consumption and lower costs.
Environmental care
Pollution
Aker BP is committed to managing pollution and minimising environmental impact by strictly complying with Norwegian regulations and discharge permit requirements. Our environmental management system focuses on preventing, minimising and remediating pollution from emissions to air and discharges to sea. We employ a mitigation hierarchy of prevention, reduction, remediation and restoration, and conduct thorough environmental impact assessments. Our efforts include enhancing energy efficiency, treating produced water and selecting low-risk chemicals.
Biodiversity
Aker BP is committed to minimising our biodiversity footprint in the areas we operate. We map and monitor biodiversity at our operational sites through the life cycle of our projects, starting with surveys of the seabed and marine life prior to drilling new wells. We regularly monitor sediments, marine life and water column in the areas surrounding our production platforms. When production at the offshore fields comes to an end, we perform post-decommissioning environmental surveys of the seabed to ensure that no hazards are left behind.
Aker BP avoids operations in legally protected areas and internationally recognised areas such as UNESCO Natural World Heritage Sites and wetlands designated under the Ramsar Convention. When operating close to or within nationally established SVOs (particularly valuable and vulnerable areas), we commit to exercising due care to avoid negative impacts on biodiversity values for which the SVO areas were designated.
Through implementation of our biodiversity policy, we commit to stepping up engagement with our value chain to promote biodiversity practices beyond our own operations and increase transparency.
Water
Aker BP’s operations are not located in water-stressed environments. All our operations are located on the Norwegian continental shelf, and freshwater usage is limited. Seawater is lifted and used for our operations such as cooling, pressure support for the reservoir and to generate freshwater offshore.
Use of freshwater is limited, and mainly used at our supply vessels and during drilling operations.
Data for consumption of freshwater from public sources can be found in our sustainability reporting supplement.
Oil spill response
Oil spills are an inherent risk in our industry. To manage this risk, risk assessments are performed to minimise the likelihood of major accidents and spill scenarios. Oil spill preparedness plans are in place for all Aker BP operations. Furthermore, in order to ensure sound preparations for and the mitigation of possible oil spills, we organise periodic training and exercises for all personnel involved, both offshore and onshore, covering oil spill response scenarios.
The operational oil spill response in Norway is handled through the Norwegian Clean Seas Association for Operating Companies (NOFO). They are specially trained to manage oil spill response operations and assume a central role with regard to mitigation measures and oil spill recovery at sea. We work continuously with NOFO to ensure that our oil spill contingency measures are dimensioned for our needs, through exercises, training, development of best practices and knowledge sharing.
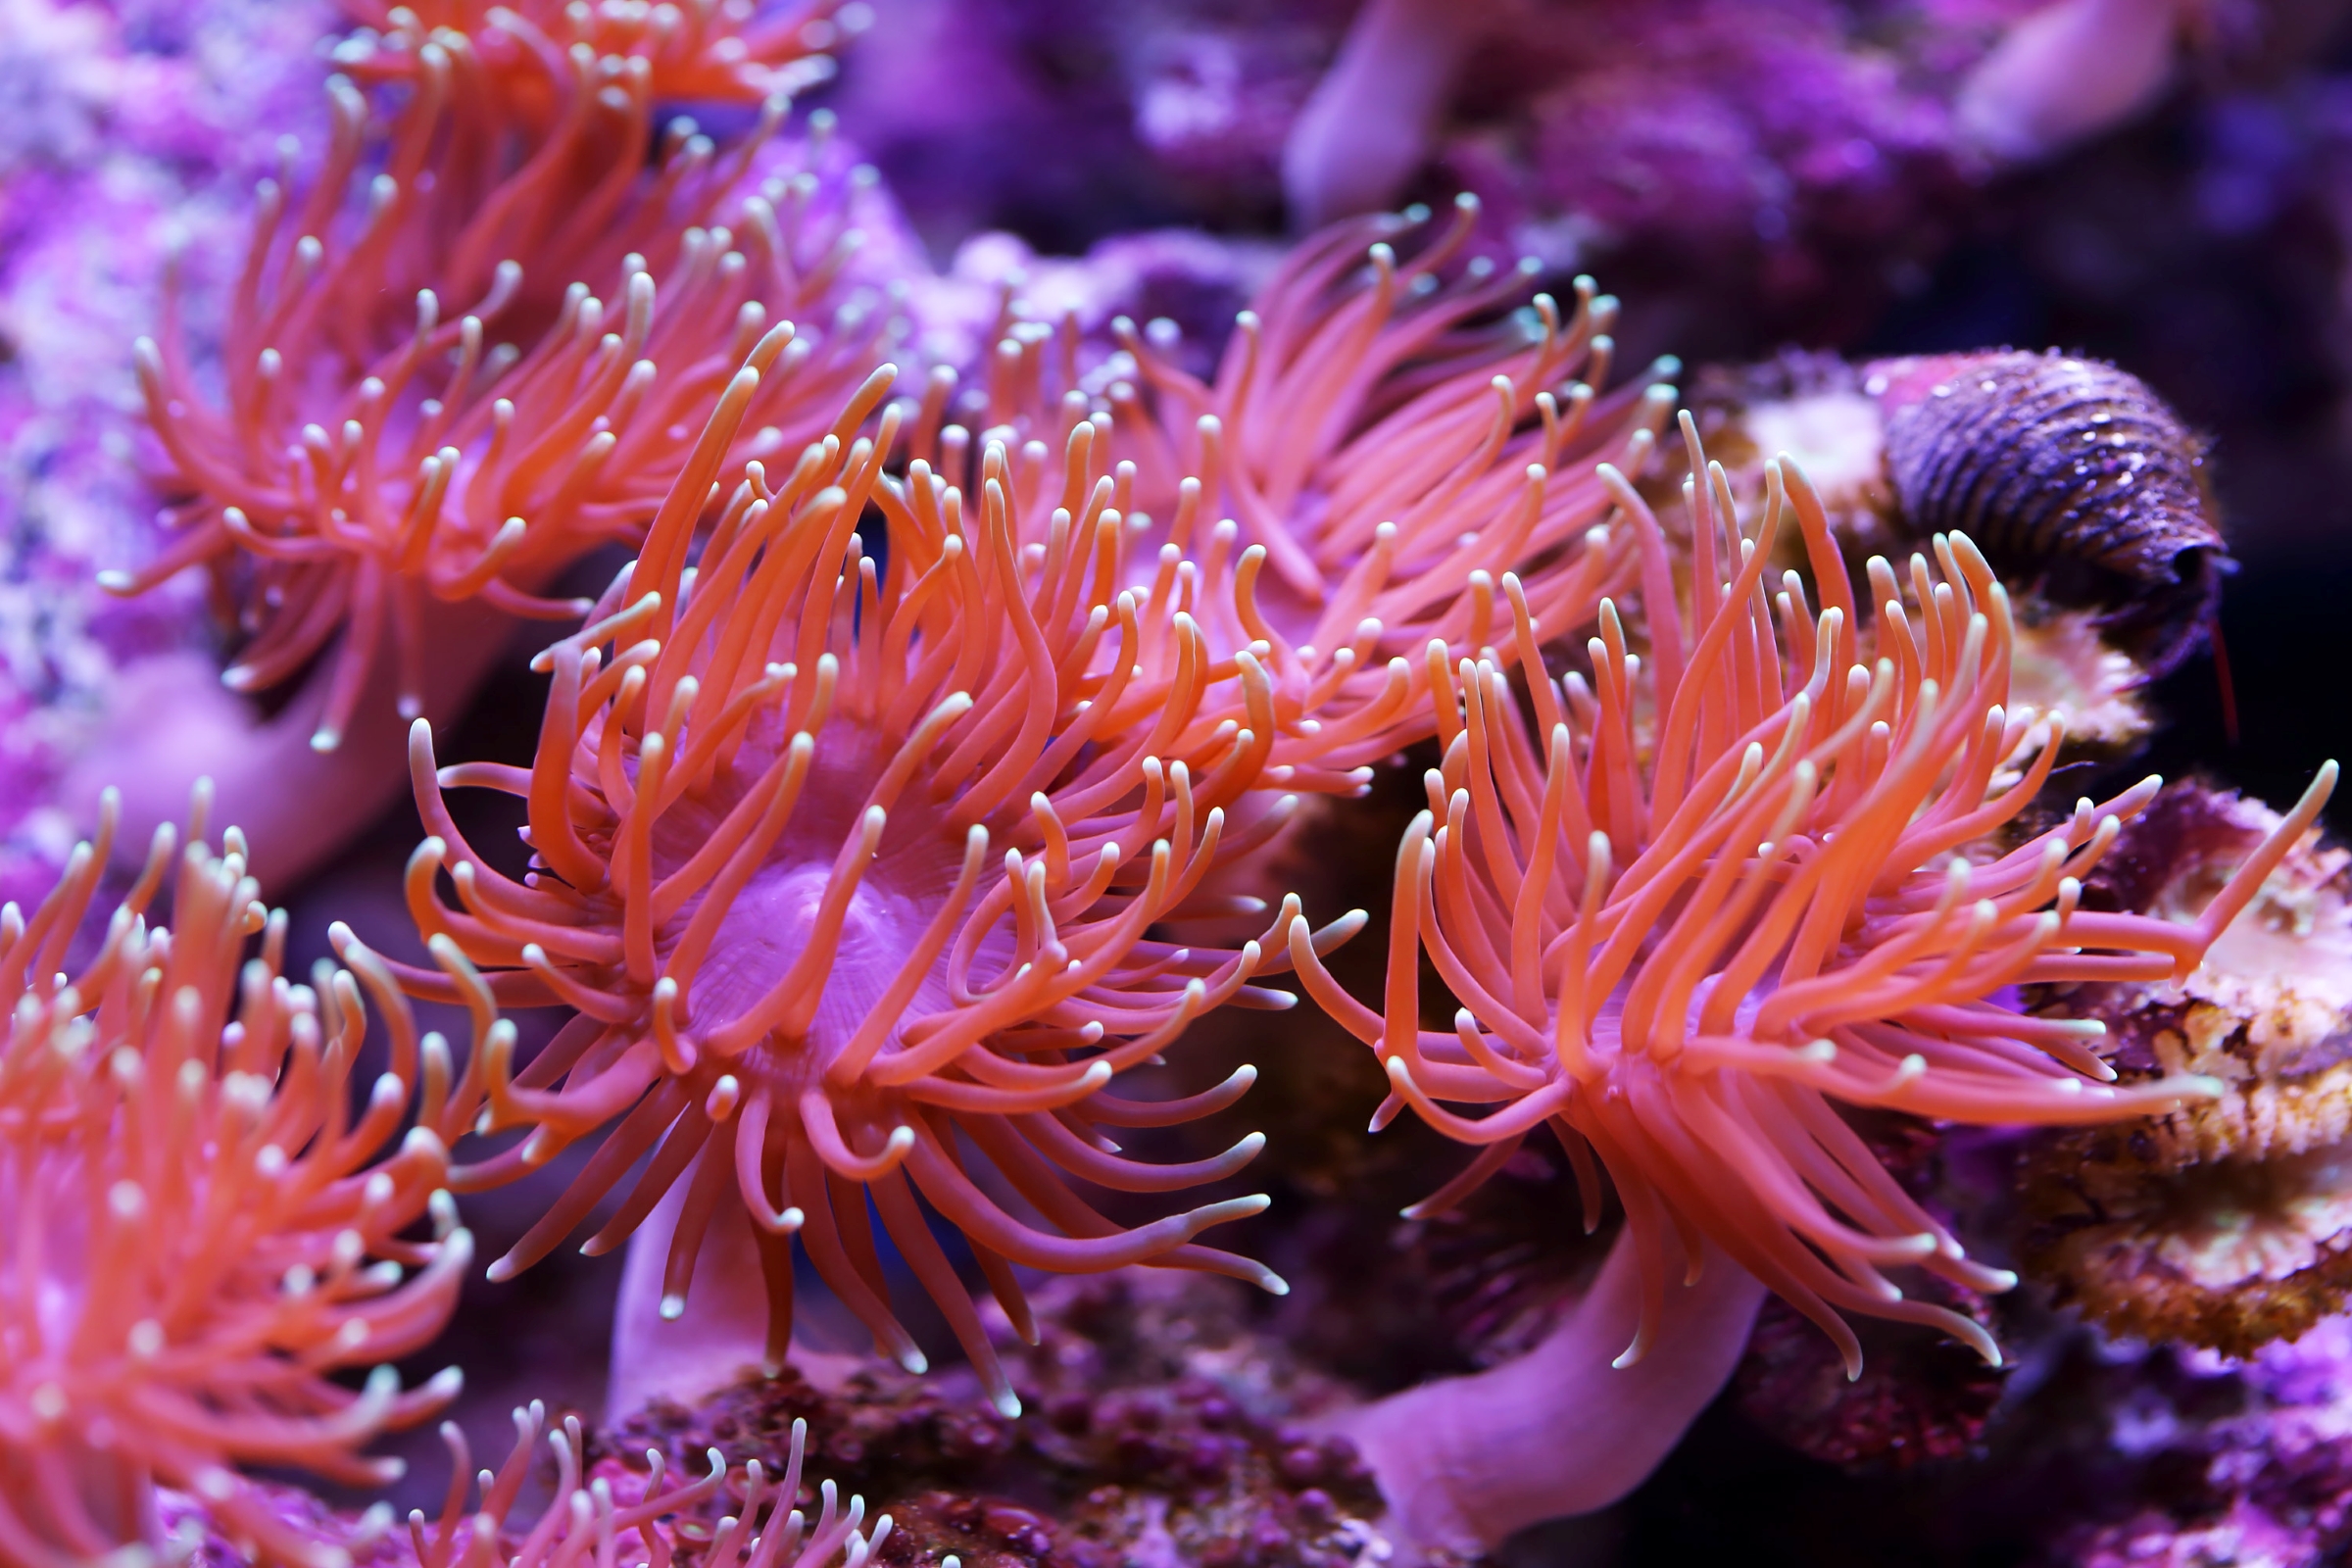
Taking care of corals
The Norwegian Sea is renowned for its numerous occurrences of cold-water corals. These organisms play a vital role in nurturing marine biodiversity, as many provide essential habitats for other species. However, they are vulnerable to physical disturbances and generally grow by only a few millimetres annually.
Over the years, the area around the Skarv field has been extensively mapped to identify corals that might be negatively affected as new discoveries are developed. Using sonar systems, we can map vast areas of seafloor topography over a short period of time. The sonar data reveals whether the seafloor is soft or hard, indicating where corals are likely to be found. We then deploy a remotely operated vehicle (ROV) to collect underwater videos and images and pinpoint the exact locations of corals and other biodiversity features. This information enables us to adjust the placement of pipelines and infrastructure to avoid crossing coral reefs and minimise impacts.
Safe operations
Safety is our top priority. We recognise that our industry involves risk, but we are committed to reducing those risks as much as possible. Our ambition is clear: zero unwanted incidents, and we expect everyone, including employees, contractors and value chain workers, to speak up and stop unsafe work.
Health and safety
We are dedicated to providing a safe and healthy working environment for all. Prevention and continuous improvement are at the core of our approach. Our safety programmes are integrated across all operations, supported by robust reporting, regular training, and a strong focus on risk and barrier management. The industry’s 9 Life-saving Rules are embedded in our daily routines, helping us to prevent serious incidents and ensure that everyone returns home safely.
Total recordable injury frequency
2.0
per million work hours (2025)
Serious incident frequency
0.3
per million work hours (2025)
Emergency preparedness
Being ready for the unexpected is essential in our line of work. Our emergency preparedness is proactive and prioritises people, the environment, assets and reputation. We conduct regular drills and exercises to ensure that our teams are always ready to respond quickly and effectively should an incident occur. Our emergency response plans are developed in close collaboration with partners and authorities, enabling rapid mobilisation and coordinated action when it matters most.
Our people
Our people are the foundation of our success. We are proud of our ‘One Team’ culture, which brings together colleagues from across the company and supply chain to collaborate, innovate and grow.
We invest in professional development, promote work-life balance and support employee well-being of every individual. Diversity, equity and inclusion are central to our values, and we strive to ensure equal treatment and opportunities for all. We are working actively to increase the proportion of women in our workforce, with a clear ambition to reach 30 percent by 2030.
3,108
Employees at year end (2025)
25.5%
Female employees (2025)
We have zero tolerance for discrimination or harassment, and everyone has a voice through our whistleblowing channels.
Regular pulse surveys help us to understand how our people are feeling, and the results show high engagement and satisfaction. We are committed to maintaining a workplace where everyone feels valued, respected and able to thrive.
Partnerships and affected communities
We strive to make a positive impact through our operations, partnerships and contributions to society. Our activities support local employment, economic development and knowledge sharing. We support local communities through sponsorships, educational initiatives and innovation partnerships, and we are always open to dialogue with those affected by our operations. Our ambition is to create long-term value, not just for our shareholders, but for society as a whole.
4,475
USD million paid in taxes (2025)
Aker BP is the second-largest taxpayer and the largest private taxpayer in Norway
150,000
full-time equivalents projected at Norwegian suppliers across the country due to Aker BP operated development projects
Responsible business
We conduct our business with integrity, transparency and respect for people and the environment. Clear governance, strong risk management and a culture of speaking up help us earn trust and create long-term value.
Ethics and compliance
Our code of conduct sets expectations for everyone who works for, or acts on behalf of, Aker BP. We have zero tolerance for corruption, and our anti-corruption procedure provides detailed guidance to help identify and prevent corruption in day-to-day work.
Speaking up
We encourage employees and external parties who work for or with us to raise concerns about potential breaches of our code of conduct, policies or applicable laws. Concerns can be reported confidentially via speakup@akerbp.com or through Aker BP’s integrity channel, which is operated by an independent third party and secured by Aker BP. Reports to the integrity channel are handled by the compliance department to ensure confidentiality and independent follow-up.
Security
Keeping people, information and assets safe is central to responsible business at Aker BP. We apply risk‑based controls across our operations, including information and cyber security, operational technology, secure‑by‑design engineering, awareness training, supplier requirements, and incident response. Security is a shared responsibility, and we expect everyone who works for or with Aker BP to follow our security requirements and report concerns promptly.
Responsible supply chain
We rely on and derive value from our global suppliers. To maintain sustainable supply chains, we perform systematic follow-up of contracts and continuously monitor both actual and potential risks, with a particular focus on health, safety, environment, human rights, business ethics and anti-corruption.
Through dialogue, verifications and audits, we gather relevant insights that enable us to prevent, detect and act on issues in our supply chain. These insights provide Aker BP with assurance that our suppliers meet legal, regulatory and contractual requirements.
Aker BP has developed long-term contracts with our largest suppliers, also referred to as ‘alliances’. This enables us to maintain a continuous focus on key risk areas and to work closely with our alliance partners on ongoing improvement and risk management in the supply chain.
Human rights
Aker BP is committed to respecting fundamental human rights. Our code of conduct and human rights policy set clear expectations for everyone we work with, whether they are part of our own organisation or our wider supply chain.
Although most of our activities are based in Norway, where the risk of human rights violations is considered low, we remain vigilant. We carry out human rights due diligence to identify and address any potential issues, and we are committed to continuous improvement. Our whistleblowing channel is open to employees, suppliers and communities, reflecting our belief that transparency and accountability are essential to building trust.
We conduct human rights due diligence in line with the UN Guiding Principles on Business and Human Rights and the OECD Guidelines for Multinational Enterprises to identify, prevent, mitigate and account for potential adverse impacts. We also collaborate across the industry, including through Offshore Qualific, to improve worker welfare and share diligence insights with peers.
Sustainability reporting
Annual reports and sustainability reports
Since 2023, Aker BP has integrated its sustainability report in the annual report.
-
PDF – 9.7 MB
-
PDF – 603 KB
CDP Climate
CDP is a not-for-profit charity that runs a global disclosure system for the benefit of society, investors, companies, cities and countries.
-
PDF – 1.65 MB
- 2023 CDP Climate Change Questionnaire
- 2022 CDP Climate Change Questionnaire
- 2022 CDP Climate Change Questionnaire Attachments
- 2021 CDP Climate Change Questionnaire
- 2020 CDP Climate Change Questionnaire
- 2019 CDP Climate Change Questionnaire
- 2018 CDP Climate Change Questionnaire
- 2017 CDP Climate Change Questionnaire
Offshore Norway reports
Sustainability data
All sustainability data is reported in line with the requirements of the European Sustainability Reporting Standards (ESRS), as required by the Corporate Sustainability Reporting Directive (CSRD), unless otherwise specified.
E1 Climate change
E2 Pollution
E3 Water and marine resources*
E5 Resource use and circular economy
Environmental fines
| Unit | 2025 | 2024 | 2023 | 2022 | 2021 | |
|---|---|---|---|---|---|---|
| Total monetary value of significant fines* | million NOK | 0 | 0 | 0 | 1 | 0 |
Health and safety
| Unit | 2025 | 2024 | 2023 | 2022 | 2021 | |
|---|---|---|---|---|---|---|
| Fatalities – employees | cases | 0 | 0 | 0 | 0 | 0 |
| Fatalities – non-employees | cases | 0 | 0 | 0 | 0 | 0 |
| Fatalities – workers in the value chain | cases | 0 | 0 | 0 | 0 | 0 |
| Serious injuries – employees | cases | 0 | 1 | 2 | 0 | 2 |
| Serious injuries – non-employees | cases | 0 | 1 | 0 | 0 | 0 |
| Serious injuries – workers in the value chain | cases | 6 | 1 | 3 | 3 | 2 |
| Serious injury frequency – employees | per million work hours | 0.0 | 0.2 | 0.5 | 0 | 0.6 |
| Serious injury frequency – non-employees | per million work hours | 0.0 | 0.6 | 0 | 0 | 0 |
| Serious injury frequency – own workforce | per million work hours | 0.0 | 0.3 | 0.4 | 0 | 0.5 |
| Serious injuriy frequency – workers in the value chain | per million work hours | 1.3 | 0.3 | 0.9 | 1.2 | 0.7 |
| Serious injury frequency – total workforce | per million work hours | 0.5 | 0.3 | 0.5 | 0.4 | 0.6 |
| Lost time injuries – employees | cases | 3 | 1 | 2 | 0 | 1 |
| Lost time injuries – non-employees | cases | 0 | 2 | 0 | 0 | 0 |
| Lost time injuries – workers in the value chain | cases | 8 | 6 | 8 | 5 | 6 |
| Lost time injury rate – employees | per million work hours | 0.6 | 0.2 | 0.5 | 0 | 0.3 |
| Lost time injury rate – non-employees | per million work hours | 0.0 | 1.2 | 0 | 0 | 0 |
| Lost time injury rate – own workforce | per million work hours | 0.4 | 0.5 | 0.4 | 0 | 0.2 |
| Lost time injury rate – workers in the value chain | per million work hours | 1.7 | 1.5 | 2.3 | 2 | 2.1 |
| Lost time injury rate – total workforce | per million work hours | 0.9 | 0.9 | 1.1 | 0.7 | 1 |
| Medical treatment injuries – employees | cases | 0 | 2 | 2 | 2 | 4 |
| Medical treatment injuries – non-employees | cases | 0 | 1 | 0 | 0 | 0 |
| Medical treatment injuries – workers in the value chain | cases | 13 | 8 | 10 | 5 | 7 |
| Total recordable injury frequency – employees | per million work hours | 0.6 | 0.6 | 0.9 | 0.6 | 1.6 |
| Total recordable injury frequency – non-employees | per million work hours | 0.0 | 1.8 | 0 | 0 | 0 |
| Total recordable injury frequency – own workforce | per million work hours | 0.4 | 0.9 | 0.7 | 0.4 | 1.2 |
| Total recordable injury frequency – workers in the value chain | per million work hours | 4.5 | 3.3 | 5.3 | 4 | 4.6 |
| Total recordable injury frequency – total workforce | per million work hours | 2.0 | 1.8 | 2.4 | 1.7 | 2.6 |
| Serious incidents | cases | 3 | 4 | 3 | 5 | 0 |
| Serious incident frequency | million work hours | 0.3 | 0.4 | 0.3 | 0.7 | 0 |
| Work hours – employees | million hours | 4.9 | 4.6 | 4.3 | 3.5 | 3.1 |
| Work hours – non-employees | million hours | 2.1 | 1.7 | 1.4 | 1 | 0.9 |
| Work hours – own workforce | million hours | 7.0 | 6.3 | 5.7 | 4.5 | 4 |
| Work hours – workers in the value chain | million hours | 4.7 | 4 | 3.4 | 2.5 | 2.8 |
| Work hours – total workforce | million hours | 11.7 | 10.3 | 9.1 | 7 | 6.9 |
| Number of tier 1 process safety events | cases | 0 | 1 | 1 | 0 | 0 |
| Number of tier 2 process safety events | cases | 0 | 1 | 0 | 0 | 0 |
| Number of tier 1 and tier 2 process safety events | cases | 0 | 2 | 1 | 0 | 0 |